Contents
0%You're spending thousands on ad creatives every month, but which ones actually drive installs, revenue, and retention? That's the exact question AppsFlyer creative analytics answers. It connects your creative assets, videos, images, playable ads, directly to performance data across every channel and campaign, so you stop guessing and start scaling what works.
For teams producing high volumes of ad variations (especially with AI tools like Starpop), creative analytics becomes the feedback loop that makes everything else worthwhile. You can generate dozens of UGC-style videos or static ads in a single session, but without granular performance insights, you're flying blind. AppsFlyer gives you the data layer that tells you exactly which hooks, formats, and visuals are pulling their weight, and which ones are burning budget without results.
This article breaks down what AppsFlyer's creative analytics suite actually does, how its AI-powered features work under the hood, and how to use it to measure and optimize your marketing creatives. Whether you're running campaigns for a single brand or managing creative output across multiple clients, you'll walk away with a clear, practical understanding of the platform and how it fits into a modern ad production workflow.
What AppsFlyer creative analytics is
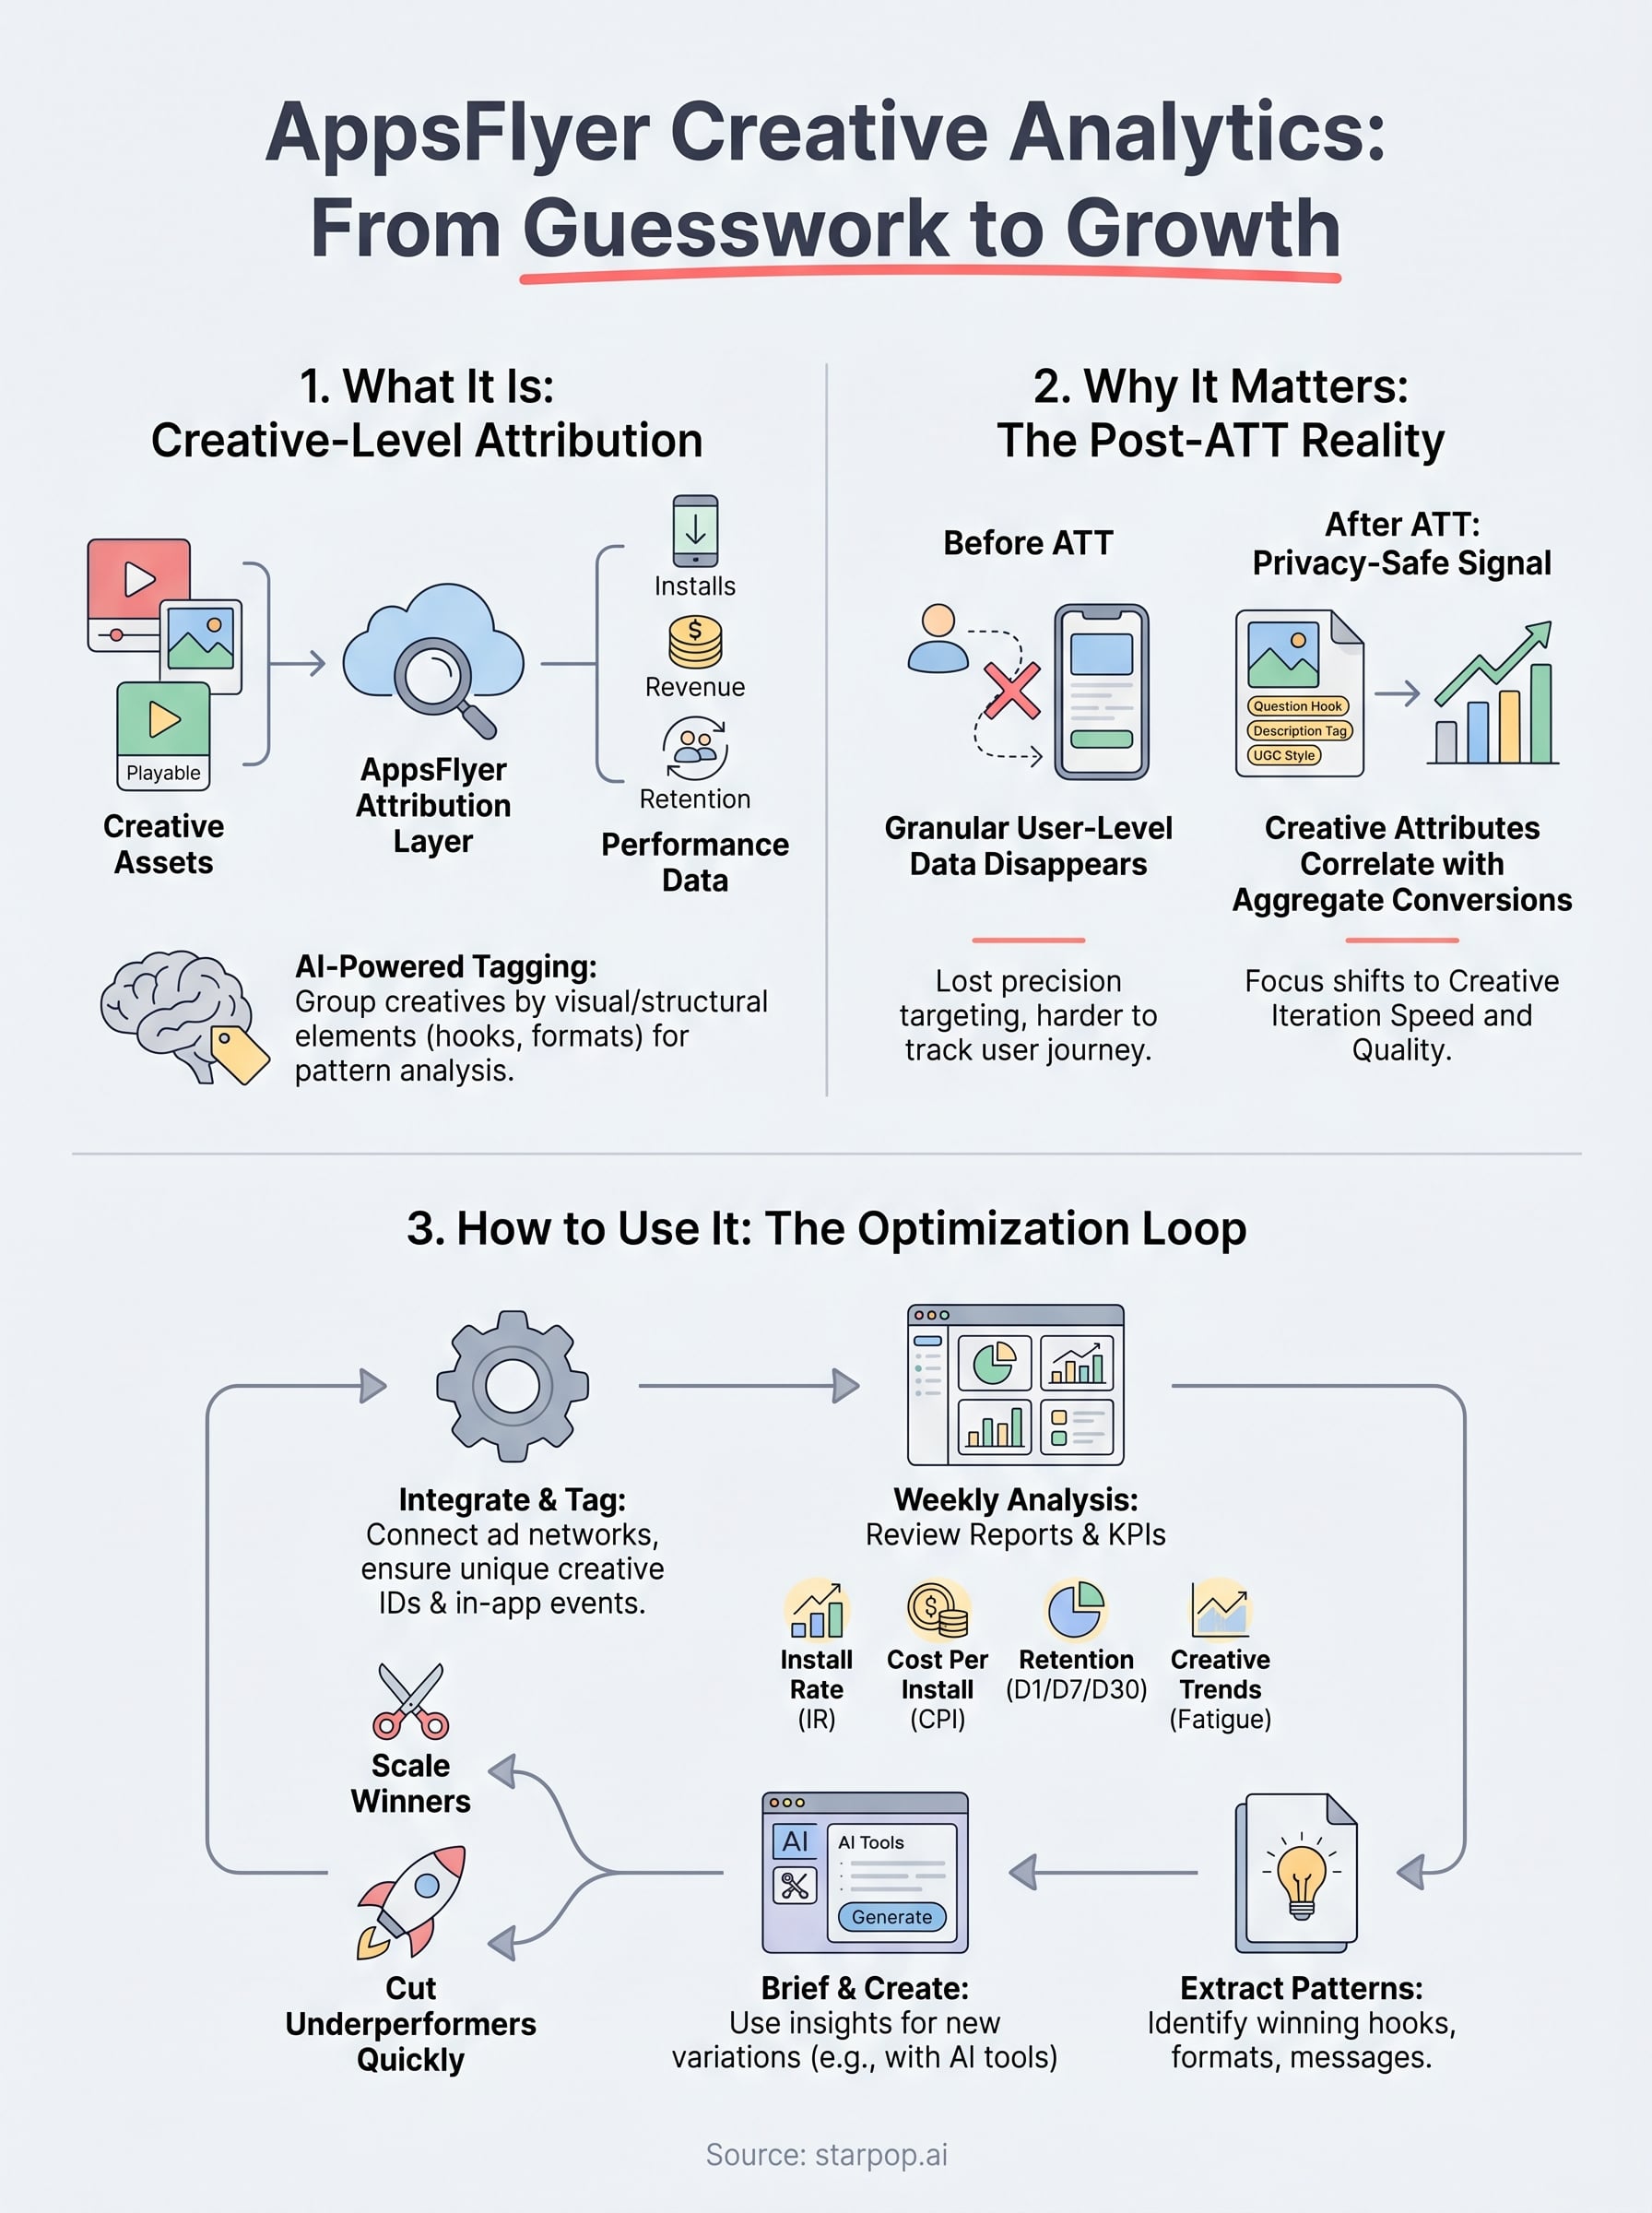
AppsFlyer creative analytics is a measurement and optimization layer built into the AppsFlyer mobile attribution platform that connects individual ad creatives, meaning specific videos, images, or carousel ads, to the downstream outcomes they produce: installs, in-app events, revenue, and retention. Instead of showing you which campaign or ad set performed well, it goes one level deeper and attributes results to the actual creative asset itself. That shift in focus changes how you make decisions, because you stop optimizing at the campaign level and start asking which visual formats, hooks, and messages actually drove real user behavior.
The core function: creative attribution
Most mobile marketers track performance at the campaign or ad set level, which tells you whether your budget is reaching the right audience, but not whether the creative itself is doing its job. AppsFlyer creative analytics solves this by linking every tracked impression, click, and conversion back to a specific creative ID across networks and campaigns. You get a unified view of creative performance regardless of which network served the ad, whether that's Meta, Google, TikTok, or any other integrated partner.
This cross-network view is what separates creative analytics from standard campaign reporting: you can see the same video performing very differently across platforms, which tells you as much about placement strategy as it does about the creative itself.
Because AppsFlyer sits at the attribution layer, it captures not just click-through conversions but also view-through attribution, giving you a more complete picture of how a creative influenced a user's decision even when they did not tap the ad immediately.
Creative clusters and AI-powered tagging
Raw creative IDs are useful, but when you're running hundreds of ad variations, you need a way to find patterns across assets without reviewing each one manually. This is where AppsFlyer's AI tagging system becomes practical. The platform automatically analyzes your creative assets and assigns tags based on visual and structural elements: whether the video opens with a person speaking to camera, uses text overlays, includes a product demonstration, or follows a problem-solution format. These tags let you group creatives into clusters and compare performance at the concept level rather than the individual asset level.

For example, you might discover that every video starting with a question-based text hook in the first three seconds outperforms product-demo openers by 40% on install rate. That's a finding you can act on immediately across every new creative you produce, including assets you generate in bulk using AI production tools.
How it fits into the broader AppsFlyer platform
AppsFlyer creative analytics is not a standalone tool. It sits inside the AppsFlyer measurement ecosystem, which means your creative performance data connects directly to your attribution data, cohort analysis, and audience segmentation. When you identify a high-performing creative, you can trace the users it brought in and measure their lifetime value and retention behavior, not just the initial conversion.
This integration matters because a creative that drives high install volume but attracts users who churn after two days is not actually a winning creative. The platform lets you track down-funnel metrics tied to specific assets, so you're optimizing for quality of user, not just quantity. That level of clarity is what makes creative analytics a genuine performance tool rather than a surface-level reporting feature.
Why creative analytics matters after ATT
Apple's App Tracking Transparency (ATT) framework, launched with iOS 14.5, fundamentally changed how mobile advertisers measure performance. When a user opts out of tracking, user-level data disappears, and the granular signals that powered campaign optimization before 2021 become unavailable. That shift forced the industry to find new ways to evaluate what's actually working, and creative analytics stepped into that gap faster than any other measurement approach.
The collapse of user-level signals
Before ATT, you could follow a specific user from ad click through install and deep into the app. That path is now blocked for a large share of iOS traffic. Aggregate measurement models like Apple's SKAdNetwork return conversion data in anonymized batches with significant delays, which means you lose the real-time, user-level visibility that campaign managers relied on. The result is that audience targeting became less precise exactly when competition for attention was rising, leaving creative quality as one of the few remaining performance levers you can still control directly.
When you lose signal on who is converting, the next best strategy is maximizing the probability that your creative itself drives action, regardless of who sees it.
Creative performance as a privacy-safe signal
Creative attributes, meaning visual elements, format structure, message type, and hooks, do not rely on individual user identifiers. A video can be tagged, clustered, and compared against other videos based entirely on its own content and aggregate outcomes, which makes creative analytics a measurement approach that works inside the new privacy-constrained environment without requiring workarounds. AppsFlyer creative analytics applies this principle directly: it evaluates how creative variables correlate with conversion rates across large enough sample sizes to produce statistically meaningful signals, even when user-level data is limited or absent.
What this means for your production workflow
The practical outcome is that creative iteration speed now matters more than it did before ATT. Because you cannot rely on precise retargeting to compensate for a weak creative, you need to generate and test more variations faster, identify the patterns that resonate with your target audience, and cut underperformers quickly before they drain your budget. This is exactly where a structured creative analytics workflow paired with high-volume AI creative production gives you a measurable edge over competitors who are still testing creatives manually and slowly.
How AppsFlyer measures creative performance
AppsFlyer measures creative performance by connecting ad impressions and post-install events to specific creative assets through a combination of deterministic attribution, probabilistic modeling, and AI-driven tagging. The platform does not treat a creative as a passive label on a campaign. It treats each asset as an independent variable whose impact on user behavior you can measure, compare, and rank against every other creative in your account.
Creative fingerprinting and asset tracking
When you upload or sync creative assets through AppsFlyer's integrations with ad networks, the platform assigns each asset a unique creative identifier that follows the asset across every campaign and placement it appears in. This means a single video you use across Meta, TikTok, and Google is tracked as one asset, and its performance data from all three networks rolls up into a single performance profile. You see total impressions, clicks, installs, and in-app events for that creative in one place rather than scattered across separate dashboards.
AppsFlyer also captures metadata at the asset level, including creative format, duration for video, dimensions for static ads, and network placement type. This metadata feeds directly into the AI tagging system, which automatically applies descriptive labels to each asset so you can filter and compare creatives by type without building manual naming conventions.
Aggregate cohort analysis tied to creatives
Beyond top-of-funnel metrics, appsflyer creative analytics tracks the downstream behavior of users acquired through each creative using cohort analysis. You can measure day-one, day-seven, and day-thirty retention rates broken down by the creative that drove the initial install, along with revenue per user and event completion rates for key in-app actions. This means you can compare two creatives that both generated 500 installs and see that one brought in users with three times the lifetime value of the other.
Optimizing for installs alone without cohort data often rewards creatives that attract low-quality users, which is one of the fastest ways to waste a scaling budget.
Normalized metrics and creative scoring
Because different creatives run at different spend levels and audience sizes, raw numbers like total installs can mislead you. AppsFlyer normalizes performance metrics against impressions and spend to produce comparable rates across assets. The platform surfaces an effective creative score that accounts for install rate, cost per install, and downstream engagement together, giving you a single ranked view of which assets are delivering the most value relative to what they cost to run.
How to use AppsFlyer to optimize creatives
Using AppsFlyer creative analytics effectively starts before your campaigns go live, not after. The platform generates its best insights when your creative assets are properly organized, your tracking integrations are active, and you have a clear framework for acting on the data it surfaces. Without that structure, you end up with a lot of numbers and no clear direction on what to change.
Set up creative tagging and integrations first
Before you launch any campaign, connect your ad network accounts to AppsFlyer through the platform's partner integrations. Meta, TikTok, Google, and most major mobile ad networks support direct creative sync, which means AppsFlyer automatically pulls in creative IDs, impressions, and click data without manual uploads. Once the integrations are active, verify that each creative asset is receiving its own unique identifier in the dashboard rather than rolling up into a generic ad set label, since that granularity is what makes creative-level optimization possible.
You should also configure your in-app event tracking at this stage. The more downstream events you map, such as purchases, subscriptions, or level completions, the more useful your cohort data becomes when you start comparing creatives against each other.
Identify your top and bottom performers weekly
Once campaigns are running with sufficient spend, pull your creative performance report on a weekly cadence and sort by install rate and cost per install normalized across spend levels. Look for clear outliers in both directions: the top 20% of creatives driving the most efficient results, and the bottom 20% consuming budget without matching conversion rates. Cut the bottom performers within that review cycle rather than letting them drain spend while you wait for more data.
A single high-performing creative identified early and scaled quickly can outperform the combined output of a dozen average creatives left running unreviewed.
Extract patterns and brief new creative variations
The most actionable step in the optimization loop is translating creative performance patterns into new production briefs. When your data shows that a specific hook format, visual structure, or message type consistently outperforms alternatives, document that pattern and use it to brief your next batch of creative variations. If you're generating assets with an AI production tool, those patterns feed directly into your prompts, letting you systematically produce higher-probability winners rather than testing randomly. That feedback loop between data and production is what separates scalable creative programs from one-off testing experiments.
KPIs and reports to watch in AppsFlyer
Knowing which reports to open and which numbers to act on separates teams that improve from teams that simply monitor. AppsFlyer creative analytics surfaces a large volume of data, so narrowing your attention to the metrics that connect creative decisions to business outcomes keeps your optimization work focused rather than scattered across numbers that don't drive action.
Creative performance report
The Creative Performance Report is your primary dashboard for comparing assets side by side. It shows install rate (IR), cost per install (CPI), impression volume, and click-through rate (CTR) for every creative in your account, normalized across spend levels so you can fairly compare a creative that ran for $500 against one that ran for $5,000. Sort by install rate first, then cross-reference with CPI to find creatives that convert efficiently at a cost that fits your unit economics.

Pull this report on a weekly cadence and treat it as your main review document. Any creative that has crossed 1,000 impressions without hitting your target IR threshold has enough data to be judged and should be paused rather than kept running on the assumption it will improve later.
Cohort and retention metrics
Top-of-funnel numbers tell you which creatives attract users. Cohort metrics tell you which creatives attract users who stay. Inside AppsFlyer, your creative cohort report breaks down Day 1, Day 7, and Day 30 retention rates alongside revenue per user, segmented by the specific creative that drove each install.
Retention rate by creative is one of the most underused metrics in mobile advertising, and the teams that track it consistently often discover they have been scaling the wrong assets for months.
A creative delivering a 20% lower CPI than average is not a winner if the users it brings in churn at twice the baseline rate. Always layer retention data on top of acquisition metrics before you decide to scale any asset.
Creative trend analysis
AppsFlyer's Creative Trends view lets you track how individual creative types perform over time, not just at a single snapshot. Creative fatigue is measurable: a video delivering a 4% install rate in week one will often fall below 2% by week four as the same audience sees it repeatedly. Monitoring trend lines by creative cluster shows you exactly when a format is declining.
Build a rotation schedule based on trend data rather than guessing when to swap assets. When a cluster shows consistent week-over-week drop-off, that signal is your brief to produce a fresh variation in the same format before the decline affects your broader campaign results.
Key takeaways and next steps
AppsFlyer creative analytics gives you a direct line between your ad creatives and the business outcomes they produce. You now know how the platform attributes performance at the asset level, why that capability matters more in a post-ATT environment, how cohort data separates good creatives from great ones, and which reports to check on a regular basis to keep your optimization cycle moving. The core principle is straightforward: measure at the creative level, identify patterns, brief new variations based on what the data shows, and cut underperformers before they drain your budget.
Applying this framework works best when you can produce high-quality creative variations quickly enough to keep pace with what the data is telling you. If generating those assets is the bottleneck, AI-powered creative production with Starpop lets you build and test multiple formats in a single session, so your creative pipeline keeps up with your analytics workflow.